Blog

  • 1pass

    1Pass – 1Password Linux CLI explorer

    1Pass is a command line application that allows to explore 1Password OPVault format. Application was created because there is no official 1Password desktop client for Linux users. Only official desktop application allows for local passwords store in OPVault format. As a long term 1Password user, I don’t want to change my passwords manager for anything else only because I am working on Linux. For me it is really important to have choice where to store my passwords. I don’t feel comfortable with my passwords in the cloud. So here is the solution. Before I made the application, every time when I forgot password, I needed to use my phone to check how it goes in passwords manager. Now I can do it on a Linux PC. What is more, I can do it in Linux way – using CLI only.

    Installation

    Application is available only for Linux x86_64. Right now it is distributed as binary only. Installation process:

    1. Go to GitHub releases section and download the newest release.
    2. Extract downloaded archive in desired location.
    3. Run extracted binary.

    If application do not run, it is probably permissions problem. Try chmod 755 1pass, this should resolve permissions problem.

    For more comfy usage, binary can be added to $PATH (in .bashrc file):

    EXPORT PATH=[path_to_binary_directory]:$PATH
    

    Recommended way is to unpack downloaded archive in /usr/bin location. It will automatically make binary executable from terminal with typing just 1pass.

    IMPORTANT: release 1.1.0 introduced update service for application (details below)

    Application updates

    From release 1.1.0, application has implemented GitHub updates mechanism. Application automatically checks for new updates and notifies user about pending one. Application is not updating without user permission. To start update, run:

    1pass update
    

    It is recommended to give application root permissions during update because it is working on computer file system.

    Whole update process:

    1. Check if there is new release on GitHub.
    2. Download newer release to temporary directory (with checksums).
    3. Extract downloaded archive.
    4. Compare checksums.
    5. Replace running binary.
    6. Clean cache (temporary files and directories).

    Configuration

    From release 1.1.0, application has implemented interactive configuration tool. From release 1.2.0, application is prompting user for configuration on first run (the most important is default OPVault path to skip writing it ad-hoc). Whole configuration process relies on questions answering.

    This is detailed description of all available settings:

    1. Do you want to set default OPVault path? ([default_answer]) [y - for yes/n - for no]: 
       Default OPVault path ([previous_value]): 
    
    This setting allows to set default OPVault path. Configured path will be used by default if flag -v is not given to 
    command.
    
    Default value: ""
    
    2. Update notifications? ([previous_value]) [y - for yes/n - for no]: [value]
    
    Decide if update notifications should be displayed. Type 'y' if yes or 'n' if no.
    
    Default value: y
    
    3. Update HTTP timeout in secods ([previous_value]) [1-30]: [value]
    
    Set HTTP timeout for updates. This setting defines how long application should try to connect with GitHub for update 
    check. Slower internet connection will need bigger value. Value should be in range from 1 to 30 seconds.
    
    Default value: 1
    
    4. How often check for updates in days ([previous_value]) [0-365]: [value]
    
    Set how often application should check for updates. Value is specified in days and should be in range form 0 to 365. 
    If 0 is set, application will check for update on every run.
    
    Default value: 1
    

    Usage

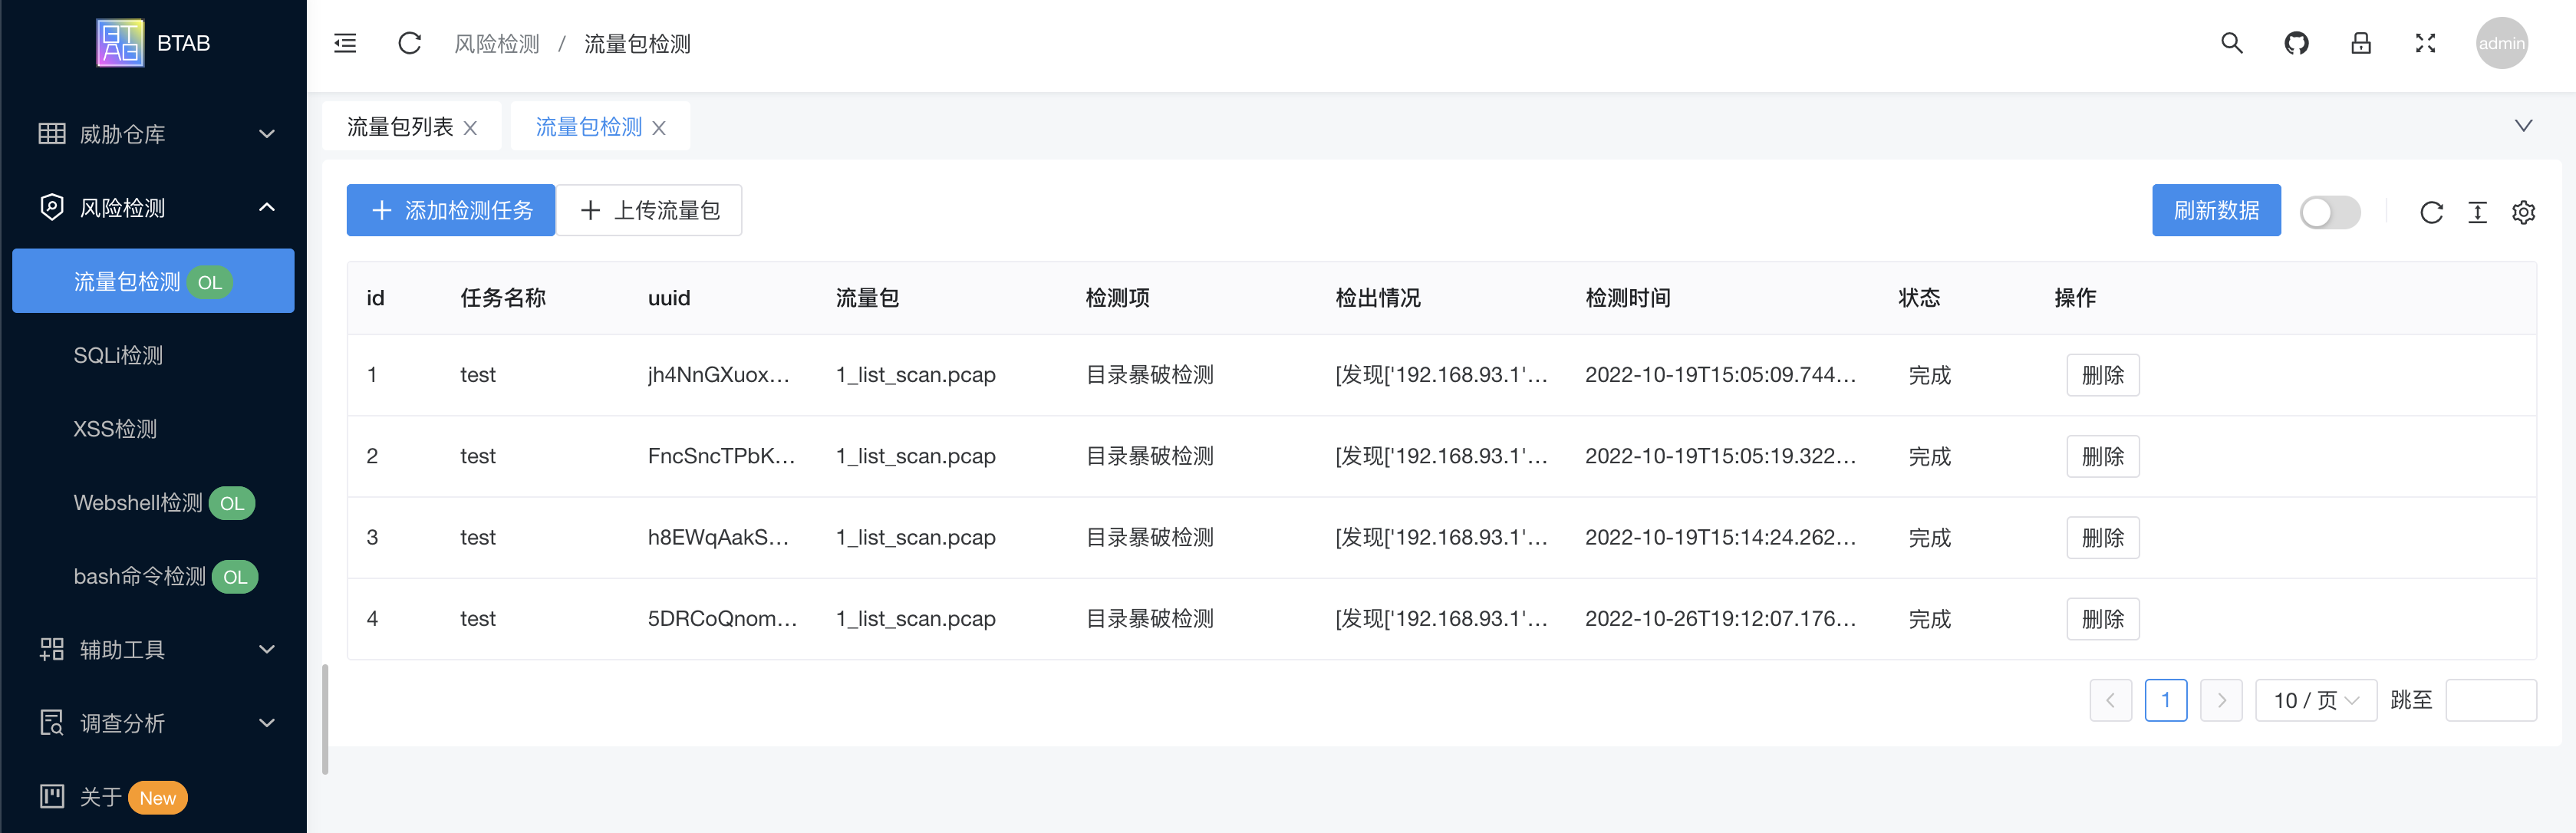
    1Pass is a command line tool, so usage is limited to command variations. First of all type:

    1pass
    

    Command should launch application in GUI mode. Application can work in command line only mode also (without GUI). Provided commands:

    1pass configure
    1pass categories
    1pass list [-c <category>] [-n <name>] [-t] <path>
    1pass overview [-t] <uid> <path>
    1pass details [-t] <uid> <path>
    1pass update
    1pass version
    
    1. configure – interactive application configuration (answer the questions), use help command to see what can be configured
    2. categories – display list of OPVault item categories (for filtering purposes)
    3. list – display list of items stored in OPVault
    4. overview – display overview of item without sensitive data
    5. details – display details of item with sensitive data
    6. update – check for update and upgrade 1pass
    7. version – check actual 1pass version

    Legend:

    • uid – unique UID of item (obtained with list command)
    • path – path to 1Password OPVault
    • -c – filter items over category
    • -n – filter items over name/title
    • -t – work on trashed items (archived)

    What is new?

    • (FIX) [GUI] Notes padding for item details
    • (FIX) [GUI] Notes padding for item overview
    • (FIX) [GUI] Invalid password loop (application will not exit after displaying invalid password error)
    • (FIX) [CLI] Inline update confirmation
    • (FIX) [CLI] Notes padding for item details
    • (FIX) [CLI] Notes padding for item overview
    • (FIX) [CLI] Accept more reasonable update timeout during configuration (in range from 1 to 30 seconds)
    • (FIX) [CLI] Update check can be shifted for one year maximum
    • (FIX) [CLI] No configuration abort on invalid values (continue with actual state)
    • (FIX) [API] Default update timeout set to 1 second
    • (FIX) [API] Clear cache (temporary directory) before update
    • (FIX) [API] Do not parse fields with value but without name

    Releases

    Versions of last five releases:

    • 1.3.1
    • 1.3.0
    • 1.2.0
    • 1.1.0
    • 1.0.0

    What next?

    All actual work on project can be tracked in GitHub issues or GitHub projects.

    Contribution guide

    Below you will find instructions how to contribute without changing my software developing workflow. All other type of contribution or contribution that do not follow rules, will be “banned” out of the box.

    Bugs

    Who likes bugged software? Probably no one. If you will find any bug in application I will be really thankful. Bugs can be reported with GitHub issues. For the proper development cycle, I want to investigate reported bug. I also want to reproduce it and prepare technical description of issue to resolve it in next release. According to that, bugs should be reported with Bug issue template and bug label. If I will reproduce the bug and find fix for it, issue will be linked to issue with bugfix label – ready to work in next releases.

    New feature or change request

    I am always opened for new ideas. New feature or change request can be reported with GitHub issues. There is special template named Request and request label. I will discuss this type of issues. If feature request/change is accepted, it will be linked with issue that has feature label – ready to implement in next releases.

    Pull requests

    It is really great if you want make some changes by yourself in my code base. First of all, some bureaucracy. Before you open issue, try to understand existing code. As you can see, this is multi module Go lang project in single GIT repository. Do you know why? I am really big fan of hexagonal software architecture because it is easier to control changes in external dependencies, core code base is a clear language (Go lang without dependencies), code is hermetic and easy to maintain. Even if it is overkill for small projects like this, it is my weapon of choice.

    How architecture looks like right now?

    • 1pass-core – core of the application (no external dependencies), business logic
    • 1pass-parse – parsing component used to read data from OPVault format
    • 1pass-up – application update component
    • 1pass-term – component used to handle CLI interaction with application
    • 1pass-app – real application (combines all of above)

    Independent Go modules makes it easier to track changes than packages.

    If everything is clear to this point and you still want to modify code, open an issue with template Bug (labels bug and pr) or Request (labels request and pr). The next step is to describe amount of work you want to do. The more detailed description, the better. Git branch name should follow the pattern:

    <latest_release>/pr/<short_issue_title_with_underscores>/<issue_number>
    
    1.0.0/pr/pretty_item_overview/#99
    

    I am trying to use Conventional commits, so it is really important that your commits also should. Example:

    feat(#11): get item overview
    tests(#11): unit tests of get item overview
    

    Look at the repository commits, you will handle it.

    Every pull request will be discussed with me and merged to develop after acceptation (unit tests are welcome).

    Visit original content creator repository https://github.com/MashMB/1pass
  • btab

    btab

    Github Release Github Downloads

    Blue team analyisis box is a tool for blue team security analyisis.

    BTAB (Blue Team Analyisis Box) is a Blue team analyisis box,focusing on attack signature analysis。It can assist security operation personnel in scenarios such as traffic packet analysis and Trojan horse analysis. Currently, it has integrated traffic packet detection, SQL injection detection, Webshell detection, bash command execution detection, and Decoding serialization and other tools.

    English – 简体中文

    contents

    items

    • key contents

    Development and compilation instructions

    Plug-in module development instructions

    Investigation and Analysis Function Description

    • slides

    btab蓝队分析工具箱-ali0th-v1.0.pdf

    Function

    The initial version mainly implements basic functions and overall processes, mainly including the following three types of functions:

    1. Threat warehouse:

    Used to store lists of traffic packets, payload files, and webshell files;

    1. Risk detection:

    Including traffic packet detection, HTTP deep analysis, SQLi detection, XSS detection and other detection items;

    1. Auxiliary tools:

    Including jq, deserialization analysis, data encryption and decryption and other processing tools;

    1. Investigation and analysis capabilities

    Using jupyter-based capabilities, you can write python scripts for analysis;

    screenshot of functional interface

    • web server

    image

    image

    image

    • juyter analyse

    analyse

    Get started

    • Download

    Go to releases to download

    • Configuration
    1. Requires tshark dependency, specify the tshark path in the config.yaml file, as follows:
    pcapAnalyseConfig:
    # tsharkPath: tshark # unix environment
    tsharkPath: C:\Program Files\Wireshark\tshark.exe # win environment
    
    1. (Optional) Java environment, some functions require the system to have a Java environment.

    2. (Optional) Use jupyter notebook related dependencies

    pip install jupyterlab
    pip install grpcio-tools
    • Execute

    Double-click to execute. After startup, visit the local port 8001: http://localhost:8001

    Development and compilation instructions

    Front-end development

    • Install dependencies
    cd frontend
    
    yarn install
    
    • Run
    yarn dev
    • Packaging
    yarn build
    • Embed the front-end into the back-end

    You need to copy the ./frontend/dist/ directory to ./backend/web/dist, and then execute it under ./backend/ to package the front-end into a go file

    go-bindata-assetfs -o web/bindata.go -pkg web web/dist/...

    Back-end development

    • Install modules
    cd ./backend
    go mod tidy
    go mod vendor
    • Packaging
    cd ./backend
    go mod tidy
    go mod vendor
    go build

    Plug-in module development instructions

    Using standard interfaces to implement unified plug-in module specifications, it is convenient to add new plug-in modules in the future. There are currently three modules, jq, pcap, and SerializationDumper. As long as there are new scenarios, they can be added.

    In addition, these plug-ins can be called by the engine and used as analysis tools in the investigation and analysis process. In theory, the capabilities can be expanded infinitely.

    For detailed code, see plugin

    Plug-in structure interface

    type Plugin interface {
       Init() // Initialization
       Set(key string, value interface{}) // Set the variables required by the plug-in
       Check() error // Check the value of the set variable
       Exec() error // Execute this plug-in
       GetState() int // Get the plug-in task progress
       GetFinalStatus() int // Get the final result
       GetResult() string // Get the output result
    }

    technology stack

    Modules Technology Remarks
    front-end framework vue
    Front-end UI framework naive ui
    backend language golang
    Backend Web gin
    Traffic packet detection logic python grpc / jupyter
    java class detection engine java embedding implementation using go embed

    Q&A

    What is the background of the development of this tool?

    Since the author has been engaged in the security industry, he has been focusing on the field of traffic security analysis, and is also interested in software research and development. On the one hand, this project is to share the usual research results and promote exchanges and learning. On the other hand, there is too little communication with the blue team in China. Now there are more red teams. I hope this way can be used to form a blue team. communication group

    Will this tool be open source?

    At best, it can only partially open source. Because of the commercial issues involved, some core detection items within the company are not convenient to open source, but some non-sensitive functional modules can be open sourced as separate projects for learning reference.

    comminicate

    You can join the group chat or add my Ali0th friend to enter the group chat.

     Edge Edge

    Update log

    v0.5.x

    The first version implements the general framework, but in order to achieve no dependency, the overall packaging is difficult, the volume is large, and the expansion capability is insufficient. The second version needs to be optimized. The analysis capability is increased through DSL syntax and python jupyter, and the expansion capability is achieved through grpc.

    • Plug-in module
    • General joint debugging engine to achieve multi-module serial processing
    • DSL syntax query function
    • Jupyter traffic packet analysis function
    • grpc implementation

    v0.3.x

    • Basic framework implementation

    Stargazers over time

    Stargazers over time

    Visit original content creator repository https://github.com/Martin2877/btab
  • UrbanGrasslandAllergens

    Allergenic properties of Berlin grasslands

    DOI

    Author: Maud Bernard-Verdier Collaborators: Birgit Seitz, Sascha Buchholz, Ingo Kowarik & Jonathan Jeschke

    This repository contains the code and data to reproduce the analyses in the manuscript entitled Grassland allergenicity increases with urbanisation and plant invasions, accepted for publication in the journal Ambio. This code analyses the allergenic properties of 56 plots of dry acidic grasslands in Berlin, Germany. This research work is part of the BIBS project, Bridging in Biodiversity Science, funded by the BMBF, Germany.

    Map of Berlin 56 grasslands

    Data

    Raw data for the project are in the data/ folder. The R script script/Import_all_data.R will import, clean and format all the data, and output four clean data tables in the clean data/ folder. Associated metadata are also provided as .csv files for these four tables.

    clean data/:

    * Species traits and allergenicity (species_allergen_data.csv)
    * Allergen molecules and biochemical families (molecule_data.csv)
    * Species abundance per grassland plot (species_abundance_data.csv)
    * Environmental factors per plot (environmental_factors_data.csv)
    

    Analyses

    The master script script/MASTER Run analyses.R will run all analyses sequentially to reproduce results and figures from the article in preparation. Result tables and figures are stored in a results/ folder. An Rmarkdown document UrbanAllergensAnalyses.Rmd is also provided to create an illustrated report summarising results.

    Figure 4

    License

    The data in this project is licensed under the Attribution-ShareAlike 4.0 International (CC BY-SA 4.0) , and the R code used to forma, analyse and display results is licensed under the MIT license.

    Visit original content creator repository https://github.com/maudbv/UrbanGrasslandAllergens
  • capmeter

    Introduction

    This is a basic capacitance meter for use with the Arduino.

    This capacitance meter is designed to be extremely cheap and quick to set up. As such, it’s not very accurate or stable, but it works. It has also been designed to be battery-friendly, taking advantage of several power-saving options in the AVR hardware. It does not use an integrated display; it uses your laptop to show output. It could be adapted to use a battery pack and an integrated display, or could be used as-is with a small tablet or cell phone capable of hosting USB serial TTY devices.

    Related Work

    Setups such as that of Jonathan Nethercott have both advantages and disadvantages compared to this one. The main advantage with his is that fewer external parts are required. Disadvantages include poorer resolution.

    Nick Gammon and Circuit Basics have yet more variants.

    The design presented below pays a little more attention to hardware specific to the AT2560, and uses fairly little Arduino helper library code.

    Setup

    1. Connect the three resistors between pins 5/A0/A1/A2 as shown below. If you don’t have exact values, you can substitute, but you need to modify the range struct as necessary.
    2. Install the latest version of the Arduino IDE.
    3. Copy and paste the code into it.
    4. Connect your Arduino over USB.
    5. Select the appropriate port and board.
    6. Upload the code.

    A note on connections

    For all connections try to use relatively short jumpers. A breadboard will work, but a project board with soldered connections (especially a proper “shield”-style board) will introduce less parasitic capacitance. Parasitic or stray elements are not fatal, but will inflate measurements in the pF range. The board partially accommodates for this with the zeroing feature.

    Portability

    This has been written for the Arduino Mega 2560, the only Arduino sitting in my toolbox. This is definitely overkill. It should be possible to port to other AVR-based Arduino systems, such as the Arduino Uno based on the ATmega328P, because it shares all of the same comparator and capture functionality. The following registers are used in the Mega code but missing in the Uno, and would require removal or replacement:

    COM1C0 COM3A0 COM3B0 COM3C0 CS30 DDRA DDRE DDRF DDRG DDRH DDRJ DDRK DDRL
    ICES3 ICNC3 MUX5 OCIE1C OCIE3A OCR3A PORTA PORTE PORTF PORTG PORTH PORTJ
    PORTK PORTL PRR0 PRR1 PRTIM3 TCCR3A TCCR3B TIMSK3 WGM30 WGM32
    

    I’d be happy to write a port for anyone who sends me the hardware. I also take pull requests for ports.

    Usage

    1. Remove any existing capacitors from the measurement pins before boot (or reboot), while leaving attached any leads you anticipate using to connect to capacitors.
    2. Connect your Arduino over USB.
    3. Select the appropriate port and board.
    4. Start the Arduino IDE’s Serial Monitor. Set the monitor to 115200 baud.
    5. Observe as the meter zeroes itself. My unloaded capacitance is usually about 50pF.
    6. Connect the capacitor to be measured as shown below.
    7. Observe as the meter converges on a capacitance value. Switching between large and small capacitors will take a few iterations for the auto-range to kick in completely.

    Design

    Schematic

             | Arduino Mega
             | 2560 Rev2
             |
             | Arduino AVR
             | Pin     Pin      Function    I/O
             |
    ---------| 5V      VCC      drive       out
    |        |
    == C     |
    |        |
    |--------|  5      PE3/AIN1 -comptor    in
    |        |
    |-270R---| A0      PF0      (dis)charge out or Z
    |--15k---| A1      PF1      (dis)charge out or Z
    |---1M---| A2      PF2      (dis)charge out or Z
             |
             |  0      PE0/RXD0 UART rx     in
             |  1      PE1/TXD0 UART tx     out
             |
             | 13      PB7      LED         out
    

    Calculations

    Digital I/O pins are 5V. Using an internal reference voltage of 1.1V for the comparator, the capture time to charge in tau-units is:

    Higher R slows down charge for small capacitance. Lower R is necessary to speed up charge for high capacitance. Too fast, and max capacitance will suffer. Too slow, and update speed will suffer. Minimum R is based on the max pin “test” current of 20mA (absolute max 40mA).

    Choose maximum R based on the impedance of the pins and susceptibility to noise. The ATMega specsheet lists a leakage current of up to 1μA at 5.5V, equivalent to a minimum input impedance of 5.5MΩ – so a drive resistor anywhere above 1MΩ doesn’t work well.

    For good range coverage, having an intermediate resistor is useful. This resistor should be close to the geometric mean of the other two:

    Board has a 16MHz xtal connected to XTAL1/2. Timer 1 is 16-bit. We can switch between prescalers of 1, 8, 64, 256 and 1024 based on capacitance.

    The maximum capacitance measured is when R is minimal, the prescaler is maximal, and the timer value is maximal:

    We don’t want to go too much higher, because that will affect the refresh rate of the result. We can improve discharge speed by decreasing R, but it cannot go so low that the current exceeds the pin max.

    Ideally, we would allow the capacitor to fully discharge between each measurement. Currently, the refresh time is hard-coded at 500ms, so for discharge to 1% or better, the measured capacitor would be at most:

    The theoretical minimum capacitance is when R is maximal, the prescaler is minimal, and the timer value is minimal:

    but practical limitations of this hardware will not do anything useful for such a small capacitance. Parasitics alone are much higher than that. Just plugging a wire into my breadboard introduced 10pF, and my typical unloaded capacitance is 50pF.

    To determine when to switch ranges, aim for a charge timer that runs up to somewhere near the 16-bit capacity to get decent resolution, choosing a good combination of R and prescaler.

    For more justification of the range choices, run range-analysis.r and check out the graphs it produces.

    Reference links

    Store – This sells the rev3, but I have a rev2.

    Board – This is the R1 schematic. My R2 is closer to the R1 than the R3. The R3 was released in Nov 2011.

    API

    Chip brief

    Chip spec

    Compilation notes

    The actual entry point is main() in here (ignoring the bootloader):

    hardware/arduino/avr/cores/arduino/main.cpp

    The include chain is:

    We need to use a lot of the SFRs directly.

    When using tools such as avr-objdump, the architecture should be avr:6, and since link-time optimization is enabled, don’t dump the .o; dump the .elf. Something like:

    avr-objdump -D -S capmeter.ino.elf > capmeter.asm
    

    Todo

    • Maybe disable the comparator via ACSR.ACD between measurements to save power – currently won’t work
    • Maybe tweak the autorange algo or enable “fast” – currently barfs sometimes
    • Dynamic refresh rate using OC3 based on capacitance and discharge minima

    Discuss

    Join the chat at https://gitter.im/capmeter/Lobby

    Visit original content creator repository https://github.com/reinderien/capmeter
  • wigglescout

    r-cmd-check codecov

    wigglescout is an R library that allows you to calculate summary values across bigWig files and BED files and visualize them in a genomics-relevant manner. It is based on broadly used libraries such as rtracklayer and GenomicRanges, among others for calculation, and mostly ggplot2 for visualization. You can look at the DESCRIPTION file to get more information about all the libraries that make this one possible.

    There are also many other tools whose functionality overlaps a little or much with wigglescout, but there was no single tool that included all that I needed. The aim of this library is therefore not to replace any of those tools, or to provide a silver-bullet solution to genomics data analysis, but to provide a comprehensive, yet simple enough set of tools focused on bigWig files that can be used entirely from the R environment without switching back and forth across tools.

    Other tools and libraries for akin purposes that you may be looking for include: deepTools, SeqPlots, bwtool, wiggletools, and the list is endless!

    wigglescout allows you to summarize and visualize the contents of bigWig files in two main ways:

    • Genome-wide. Genome is partitioned on equally-sized bins and their aggregated value is calculated. Useful to get a general idea of the signal distribution without looking at specific places.
    • Across sets of loci. This can be either summarized categories, or individual values, as in genome-wide analyses.

    wigglescout functionality is built in two layers. Names of functions that calculate values over bigWig files start with bw_. These return GRanges objects when possible, data.frame objects otherwise (i.e. when values are summarized over some category, genomic location is lost in this process).

    On the other hand, functions that plot such values and that usually make internal use of bw_ functions, start with plot_.

    Installation

    wigglescout is a package under active development. You can install it from this repository. For this, you will need remotes to install it (and devtools if you plan to work on it):

    install.packages(c('devtools', 'remotes'))
    

    Additionally, there was an issue in the past with installing dependencies that come from BioConductor repository. This seems to have been fixed now, but if you run into problems, I recommend installing manually these dependencies before running the installation:

    install.packages(('BiocManager'))
    BiocManager::install(c('GenomeInfoDb', 'GenomicRanges', 'rtracklayer'))
    

    Then you can install directly from this GitHub repository:

    library(remotes)
    remotes::install_github('cnluzon/wigglescout', build_vignettes = TRUE)
    

    Getting started

    The vignettes or online documentation can give a comprehensive overview of what is available in the package. You can check the vignettes with browseVignettes("wigglescout").

    Troubleshooting

    Q: When running install_github I get the following error:

    Error: package or namespace load failed for ‘GenomeInfoDb’ in loadNamespace(i, c(lib.loc, .libPaths()), versionCheck = vI[[i]]):
    there is no package called ‘GenomeInfoDbData’
    Error: package ‘GenomeInfoDb’ could not be loaded
    Execution halted
    

    A: This seemed to be a problem that came from installing Bioconductor dependencies. A workaround is installing the BioConductor packages manually:

    if (!requireNamespace('BiocManager', quietly = TRUE))
        install.packages('BiocManager')
    
    BiocManager::install(c('GenomeInfoDb', 'GenomicRanges', 'rtracklayer'))
    
    Visit original content creator repository https://github.com/cnluzon/wigglescout
  • business-app-development-project

    business-app-development-project

    Project for Business Application Development Course, third semester. The project is about Janji-Jywa Application. Janji Jywa is a simple JBDC and MySQL application that manages all the transaction and the system of the beverage. Admins in this application could manage the inventory of the beverages, while the customers could buy the beverages.

    Before running the java project file, please establish a MySQL server connection with the java project using XAMPP by making a MySQL database named ‘janji_jywa’. After that, please run the following syntax code in the MySQL query:

    — phpMyAdmin SQL Dump
    — version 5.0.2
    https://www.phpmyadmin.net/

    — Host: 127.0.0.1
    — Generation Time: May 28, 2021 at 08:41 AM
    — Server version: 10.4.13-MariaDB
    — PHP Version: 7.4.7

    SET SQL_MODE = “NO_AUTO_VALUE_ON_ZERO”;
    START TRANSACTION;
    SET time_zone = “+00:00”;

    /*!40101 SET @OLD_CHARACTER_SET_CLIENT=@@CHARACTER_SET_CLIENT /;
    /
    !40101 SET @OLD_CHARACTER_SET_RESULTS=@@CHARACTER_SET_RESULTS /;
    /
    !40101 SET @OLD_COLLATION_CONNECTION=@@COLLATION_CONNECTION /;
    /
    !40101 SET NAMES utf8mb4 */;


    — Database: janji_jywa


    — Table structure for table beverages

    CREATE TABLE beverages (
    BeverageID char(5) DEFAULT NULL,
    BeverageName varchar(30) DEFAULT NULL,
    BeverageType varchar(30) DEFAULT NULL,
    BeveragePrice int(11) DEFAULT NULL,
    BeverageStock int(11) DEFAULT NULL
    ) ENGINE=InnoDB DEFAULT CHARSET=utf8mb4;


    — Dumping data for table beverages

    INSERT INTO beverages (BeverageID, BeverageName, BeverageType, BeveragePrice, BeverageStock) VALUES
    (‘BE001’, ‘Boba Ashiap’, ‘Coffee’, 10000, 10),
    (‘BE002’, ‘Es teh manis’, ‘Tea’, 12000, 97),
    (‘BE003’, ‘Mango smoothie’, ‘Smoothies’, 20000, 100),
    (‘BE004’, ‘Boba kocak’, ‘Boba’, 19000, 118);


    — Table structure for table carts

    CREATE TABLE carts (
    UserID char(5) NOT NULL,
    BeverageID char(5) NOT NULL,
    Quantity int(11) NOT NULL
    ) ENGINE=InnoDB DEFAULT CHARSET=utf8mb4;


    — Table structure for table detailtransactions

    CREATE TABLE detailtransactions (
    TransactionID char(5) NOT NULL,
    BeverageID char(5) NOT NULL,
    Quantity int(11) DEFAULT NULL
    ) ENGINE=InnoDB DEFAULT CHARSET=utf8mb4;


    — Dumping data for table detailtransactions

    INSERT INTO detailtransactions (TransactionID, BeverageID, Quantity) VALUES
    (‘TR001’, ‘BE001’, 22),
    (‘TR002’, ‘BE002’, 3),
    (‘TR002’, ‘BE004’, 2);


    — Table structure for table headertransactions

    CREATE TABLE headertransactions (
    TransactionID char(5) NOT NULL,
    UserID char(5) DEFAULT NULL,
    TransactionDate date DEFAULT NULL
    ) ENGINE=InnoDB DEFAULT CHARSET=utf8mb4;


    — Dumping data for table headertransactions

    INSERT INTO headertransactions (TransactionID, UserID, TransactionDate) VALUES
    (‘TR001’, ‘US002’, ‘2021-05-28’),
    (‘TR002’, ‘US002’, ‘2021-05-28’);


    — Table structure for table users

    CREATE TABLE users (
    UserID char(5) DEFAULT NULL,
    UserName varchar(30) DEFAULT NULL,
    UserEmail varchar(50) DEFAULT NULL,
    UserPassword varchar(30) DEFAULT NULL,
    UserDOB date DEFAULT NULL,
    UserGender varchar(10) DEFAULT NULL,
    UserAddress varchar(255) DEFAULT NULL,
    UserPhone varchar(30) DEFAULT NULL,
    UserRole varchar(10) DEFAULT NULL
    ) ENGINE=InnoDB DEFAULT CHARSET=utf8mb4;


    — Dumping data for table users

    INSERT INTO users (UserID, UserName, UserEmail, UserPassword, UserDOB, UserGender, UserAddress, UserPhone, UserRole) VALUES
    (‘US001’, ‘Revaldi Mijaya’, ‘admin’, ‘admin’, NULL, ‘Male’, ‘asdasdasdasd Street’, ‘0920398193812319’, ‘Admin’),
    (‘US002’, ‘daniel fujiono’, ‘customer’, ‘customer’, NULL, ‘Male’, ‘binus Street’, ‘012345678911’, ‘Customer’);


    — Indexes for dumped tables


    — Indexes for table carts

    ALTER TABLE carts
    ADD PRIMARY KEY (UserID,BeverageID);


    — Indexes for table detailtransactions

    ALTER TABLE detailtransactions
    ADD PRIMARY KEY (TransactionID,BeverageID);


    — Indexes for table headertransactions

    ALTER TABLE headertransactions
    ADD PRIMARY KEY (TransactionID);
    COMMIT;

    /*!40101 SET CHARACTER_SET_CLIENT=@OLD_CHARACTER_SET_CLIENT /;
    /
    !40101 SET CHARACTER_SET_RESULTS=@OLD_CHARACTER_SET_RESULTS /;
    /
    !40101 SET COLLATION_CONNECTION=@OLD_COLLATION_CONNECTION */;

    Visit original content creator repository
    https://github.com/melvinsinatra/business-app-development-project

  • Plubell_2017_PAW

    Plubell_2017_PAW

    Data from Plubell et al., 2017 processed with PAW pipeline

    A lot of work has happened since the 2017 MCP paper. In that first publication, IRS was done in Excel. It really is a simple enough idea to do that. It is labor intensive and possibly error-prone, though. I have a data analysis pipeline originally developed for SEQUEST search results that is written in Python. It has nice protein inference and protein grouping steps. It has been updated to work with Comet search results (at least up through 2016 versions).

    One thing I do not like about Proteome Discoverer, is the protein inference and how shared peptides are used in quantification. The PSM export files from PD have all of the same fields that the PAW pipeline needs, along with the reporter ion information. It is possible to take the confidently identified PSMs in the PD exports and run them through the later stages of the PAW pipeline. Support for TMT reporter ions was added.

    The PAW pipeline used MSConvert of the ProteoWizard package to extract the MS2 scan information for Comet searches. Support to extract the reporter ion scan peak heights was added. Now the PAW pipeline can take TMT data exported from PD and produce protein-level quantitative reports, or data straight from RAW files in a full open source pipeline.

    The data from the original publication was depositied in PRIDE and has been re-analyzed with Proteome Discoverer 2.2, PAW/Comet, and MaxQuant. Notebooks for analysis of these different workflows will be added eventually.

    One very important part of doing an IRS experiment that uses pooled internal standards, is making sure that those channels are correctly specified. There is nothing about the IRS procedure that has any knowledge of the correct channels to use for the internal standards except you! If you make a mistake in the standard channel designations, your data will get messed up. Like most computer use, there is no real way to protect you from yourself. The quality and accuracy of the record keeping is on you.

    That said, we can actually get the computers to help us double check our records of which channels were the pooled standard channels. The “auto_finder_PAW” notebook show you how to see which channels are the most similar in a TMT plex without specifying any sample information. The notebook reads the PAW results files, but the concepts would apply to other results files (PD or MaxQuant).

    I will add more content to this repository as time allows.

    December 23, 2018 – Phil W.

    Visit original content creator repository
    https://github.com/pwilmart/Plubell_2017_PAW

  • binar-challengech7

    binar-challengech7

    Binar Academy Full Stack Web Development Challenge Chapter 7 – Auth & Multiplayer

    Postman Documentation : Click here or https://documenter.getpostman.com/view/13057273/TVspmA4x

    Step-by-step to run the app

    1. Clone the repository.
    2. Run in terminal : npm install to install all required packages that listed in packages.json.
    3. Make database in pgAdmin.
    4. Make your own .env environment file based on .env.example. Make sure the database name is right. Also specify the session name & secret for cookies.
    5. Migrate database tables and populate seeders.
    6. Run Server in terminal using : npm run start or yarn start.

    STEP-BY-STEP to Test middlewares & controllers (for example, I will use port 3000)

    1. Go to index page, you can enter localhost:3000/ or localhost:3000/index or localhost:3000/home. The result will be the same, index page.
    2. You’re not logged in yet, so you couldn’t access private routes. Try to access localhost:3000/profile or play the game by clicking PLAY NOW button on index page. The server will redirect you to login page (localhost:3000/auth/login).
    3. If you have not registered yet, you can register first by clicking SIGN UP button (localhost:3000/auth/signup) in the top right side
    4. Test the basic form validation. You can find the requirement to fill the form inside middlewares > validation folder. If all conditions are not met, the server will return an error message.
    5. If the Sign up/registration is successful, check new user entry in db. Also see that the given password has been hashed by bcrypt.
    6. Try to login with any credentials from seeder or your own registered account. You also can test the basic form validation here. Also because server use bcrypt, server will compare the inputed password with the hashed one from db. If the login is succesful, you will be redirected by server to index page again. Now see that in the top right side that the navbar menu has changed.
    7. Now you are logged in, so you can’t access localhost:3000/auth/signup or localhost:3000/auth/login anymore. Try to test it from browser URL. If you try to access them, you will be directed to index page.
    8. When you logged in, server will give you cookies and session that expires for 2 hours. This cookies required to authenticate user login. If the cookies expired or deleted, user need to login again.
    9. Click LOGGED IN AS username in right side of navbar to go to your profile. This is your profile biodata. You can edit profile, change password or delete all user data.
    10. Now try to edit profile first by clicking EDIT PROFILE button. Here, all form fields are not set as required field. So you can edit 1 or 2 things, or even nothing. But, some validation still works here. If you’re done, click SUBMIT button. If you leave the form without filling any fields, the submit won’t change any data. Email and username can’t be changed. Once used, you need another to do another registration. You will be redirected to profile page after click the SUBMIT button. See if any of your profile data has changed.
    11. Now try to change your password by clicking CHANGE PASSWORD button in profile page. Try the validation again. You can’t use old password as your new password. Again, bcrypt will do their task to compare and hash the password.
    12. Now go back to index page or just jump into game page by enter localhost:3000/game. You can see that you are playing against com. Try to play some games. The REFRESH button on the bottom also acts as the trigger to post game history.
    13. After some games, you could check your game history by clicking SEE GAME HISTORY button on the top right side of game page. The list of your userGameHistories table from database will be sorted from newest to oldest by timestamps. In the right side, you can click ❌ button to delete the specific game history.
    14. If you’re done, go back to your profile and now try delete all user data by clicking DELETE ALL USER DATA button. You will be logged out (this is the same thing will be happen if you click LOG OUT button in navbar, but without delete the data). Your cookies and session will also be destroyed after Log out or delete all user data. Check the database that all data that associated to the user also gone (game histories and user biodata/profile).

    Packages used :

    • bcrypt : Password hashing
    • cookie-parser : Populate req.cookies
    • dotenv : Environment
    • ejs : View Engine
    • express : Node.js Framework
    • helmet : Secure HTTP headers
    • joi : Form Validation
    • jsonwebtoken : JWT for authentication
    • method-override : Override POST method in form
    • morgan : Logger (see the log on node console)
    • node-fetch : window.fetch inside node.js
    • pg : PostgreSQL client
    • sequelize : Sequelize ORM
    • Babel.js : Transcompiler
    • ESLint : Linter – airbnb based
    • nodemon
    • sequelize-cli : Sequelize Command Line Interface (CLI)

    Folders :

    • public -> Serve static files (css, images, js, etc).
    • configs -> config file(s).
    • controllers -> controllers for user interactions.
    • middlewares -> JWT authentication, admin role authentication & joi validation.
    • migrations -> migration for db tables.
    • models -> model mapping.
    • routes -> web routes.
    • seeders -> populate dummy data into migrated db tables.
    • views -> act as views in MVC pattern using EJS.

    Visit original content creator repository
    https://github.com/alvinlaurente/binar-challengech7

  • UTI-Diagnosis-Classification

    U.T.I Diagnosis Classification

    GitHub repo size

    GitHub License

    In this repository, the researchers utilized a hybrid approach using five (5) machine learning models and one (1) deep learning model to tune, train and evaluate using labaled urinalysis tests results. This repository is based on the implementation of methodology of the researchers capstone entitled – Optimizing UTI Diagnosis with Machine Learning and Artificial Neural Networks for Reducing Misdiagnoses by Agapay, N.K., Agdeppa, K.R., Dabalos, D.G., and Virtudez, J.L.. Moreover, The models were trained and evaluated using Python 3.10.6 and NVIDIA T4 x2 from Kaggle.

    Dependencies

    The user needs to install the prerequisites.

    pip install -r requirements.txt
    

    or

    conda install --yes --file requirements.txt
    

    Background

    The burden of Urinary tract infections (UTIs) extends beyond the healthcare system, as it significantly impacts individuals’ quality of life and productivity (Medina et al., 2019). UTIs are a widespread and recurrent health problem that affects millions of individuals worldwide and can have various adverse effects on individuals, ranging from mild discomfort to severe complications. They can lead to significant morbidity and even mortality, especially among vulnerable populations such as the elderly, pregnant women, and individuals with compromised immune systems (Hooton, 2012). UTI symptoms can have a crucial impact on an individual’s physical and emotional well-being, disrupting daily activities and sleep patterns. Moreover, UTI can affect an individual’s productivity, leading to absences from work or school leading to decreased performance.

    Methodology

    The figure below illustrates the pipeline used for model selection and classification. The pipeline encompasses vital steps and processes for achieving unbiased classification results, including data exploration, data preparation, and model evaluation to ensure that the optimal model is selected for the system integration.

    Visit original content creator repository https://github.com/kr-agdeppa/UTI-Diagnosis-Classification
  • data_legislatives_2024

    Projet de mise à disposition de données ordonnées, de chiffres-clefs et de visualisations inédites sur les élections législatives françaises anticipées de 2024.

    Visualisations :

    Si vous consultez ce README depuis GitHub, cliquez ici pour avoir accès aux visualisations interactives.

    Images issues des visualisations interactives téléchargeables ici.

    <script src=”https://github.com/IdrissaD/https://public.flourish.studio/resources/embed.js”></script>
    ⬊ 20 autres nuances
    <script src=”https://github.com/IdrissaD/https://public.flourish.studio/resources/embed.js”></script>
    <script src=”https://github.com/IdrissaD/https://public.flourish.studio/resources/embed.js”></script>

    Données source :

    Résultats des 577 circonscriptions françaises.

    Méthode :

    • Jointure des résultats avec les données géolocalisées via le code de circonscription.
    • Réordonnançement des données avec PostgreSQL (renommage et retypage des champs, création d’une ligne par candidat·e, etc.) (cf. preparation_des_donnees.sql)
    • Attribution d’un bloc de clivage à chacune des 24 nuances définies par le Ministère de l’Intérieur
    ⬊ Nuances et leur regroupement par bloc de clivage

    Code Nuance (définie par le Ministère de l’Intérieur et des Outre-mer) Commentaires du Ministère Bloc de clivage (défini subjectivement par mes soins)
    EXG Extrême gauche Candidats présentés ou soutenus par des partis d’extrême gauche, notamment Lutte ouvrière, le nouveau Parti Anticapitaliste, Parti ouvrier indépendant extrême gauche
    COM Parti communiste français Candidats présentés ou soutenus par le Parti communiste Français gauche
    FI La France insoumise Candidats présentés ou soutenus par La France insoumise gauche
    SOC Parti socialiste Candidats présentés ou soutenus par le Parti socialiste gauche
    RDG Parti radical de gauche Candidats présentés ou soutenus par le Parti radical de gauche gauche
    VEC Les Écologistes Candidats présentés ou soutenus par Les Écologistes gauche
    DVG Divers gauche Autres candidats de sensibilité de gauche gauche
    UG Union de la gauche Candidats présentés ou soutenus par deux partis de gauche gauche
    ECO Ecologiste Autres candidats de sensibilité écologiste gauche
    REG Régionalistes Candidats régionalistes, indépendantistes et autonomistes divers
    DIV Divers Candidats inclassables divers
    REN Renaissance Candidats présentés ou soutenus par Renaissance centre
    MOM Modem Candidats présentés ou soutenus par le Mouvement démocrate centre
    HOR Horizons Candidats présentés ou soutenus par Horizons centre
    ENS Ensemble Candidats présentés ou soutenus par deux partis du centre centre
    DVC Divers centre Autres candidats de sensibilité du centre centre
    UDI Union des Démocrates et Indépendants Candidats présentés ou soutenus par l’Union des démocrates et indépendants centre
    LR Les Républicains Candidats présentés ou soutenus par Les Républicains droite
    DVD Divers droite Autres candidats de sensibilité de droite droite
    DSV Droite souverainiste Debout la France, autres partis ou candidats de sensibilité souverainiste extrême droite
    RN Rassemblement National Candidats présentés ou soutenus par le Rassemblement national extrême droite
    REC Reconquête Candidats présentés ou soutenus par Reconquête ! extrême droite
    UXO Union de l’extrême droite Candidats présentés ou soutenus par deux partis d’extrême droite extrême droite
    EXD Extrême droite Candidats présentés ou soutenus par d’autres partis d’extrême droite, notamment Les Patriotes, Comités Jeanne, Mouvement National Républicain, Les identitaires , Ligue du Sud, Parti de la France, Souveraineté, Identité et Libertés (SI EL), Front des patriotes républicains, etc. extrême droite


    Données produites :

    • liste des 70 102 bureau de votes des législatives 2024, avec leur commune, circonscription législative, arrondissement, département et région respectifs
    • tableau des nuances et blocs de clivages se présentant aux législatives 2024
    • liste des
    • résultats du 1er tour des législatives 2024, circonscription par circonscription (fichiers géolocalisés)
    • résultats du 1er tour des législatives 2024, candidat·e par candidat·e (un fichier géolocalisé, un fichier CSV)
    • statistiques genrées :
      • Répartition des positions (qualifiable, élu·e) après le premier tour selon le département, la nuance et le bloc de clivage
      • Nombre de voix moyen et médian, taux de votes par rapport au nombre d’inscriptions et de votes exprimés, par département, nuance et bloc de clivage

    Données téléchargeables sur data.gouv.fr et GitHub

    Visualisations interactives disponibles sur Flourish : https://app.flourish.studio/@idrissad

    Licences :

    Code : GNU General Public License v3.0

    Données : ODbL

    Images : CC-BY-SA 4.0

    (En gros vous réutilisez ce que vous voulez, pour usage commercial ou non, mais vous devez conserver les mêmes licences pour les réutilisations. Cycle vertueux de la donnée ouverte, tout ça…)

    Visit original content creator repository
    https://github.com/IdrissaD/data_legislatives_2024